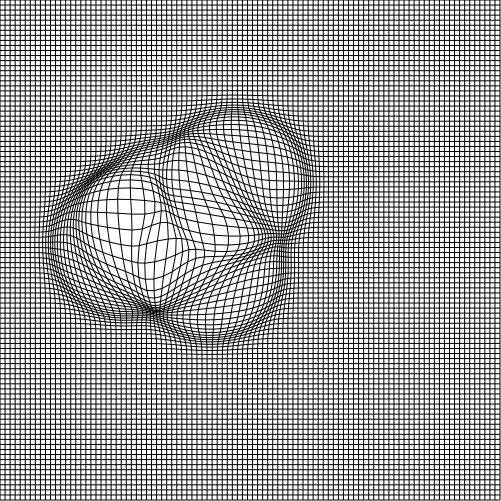
At the Łódź Design Festival last weekend, I saw this exercise in data visualisation and sonification. Culling data pulled from one of the major Hungarian news sites –www.origo.hu, Kitchen Budapest’s animation tells you something you already know, that the capital dominates the country. One in four Hungarians live in the Budapest metropolitan area. At 30 frames per second, each frame represents a single day. One month flashes by in a second. And the animation covers the period from December 1998 until October 2010. Every time a Hungarian town or city is mentioned on the pages of origo.hu, this digital map of the country pulses. The country bulges to accommodate the waves of news. At the same time the sound – a buzzing harmonic drone – echoes the visual effects.
Undeniably mesmerising, like so many of these attempts to animate data, one is left wondering what it all means. This visualisation boils in two ways – the line flickers in the manner that animators call boiling and the surface of the country bubbles with geothermal energy. There is another, far less appealing association too: Budapest seems to be constantly erupting like some kind of malignant ulcer. It would be easy to read or misread this project as a kind of objection to the megalopolis. Surely this is not Kitchen Budapest’s intention?
